
The average Chelmsford home was worth £378,412 in September, 0.8% down on a year, after a 2.4% fall first reported for August. Semi-detached homes are rising again.
Chelmsford house prices are still lower than a year ago, but the fall has slowed sharply. The average home in the district was worth £378,412 in September. That is £2,951 less than in September 2025, a fall of 0.8% (HM Land Registry).
In August the annual fall was 2.0% on the revised figures. Prices also rose slightly between August and September, by 0.1%, or about £360.
Chelmsford is still the second-weakest of the 14 local authorities in Essex. Only Tendring, down 2.2%, has fallen further.
The figures come from the UK House Price Index for September, published on 18 November (GOV.UK). They are built from completed sales lodged with the Land Registry, so they run two months behind.
Two things to know before the numbers:
- This is a mean average, not a median. A few expensive sales pull it up.
- The index is revised every month, and this time the revision helped. August now reads £378,055 and a 2.0% fall. We reported it last month as £376,682 and 2.4%, the figures published then.
Five months below last year, but the gap is closing
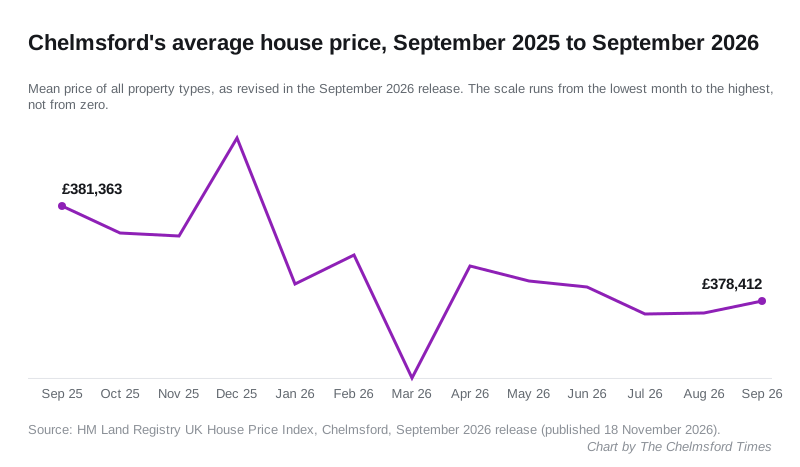
On the revised figures, Chelmsford prices have been lower than a year earlier in every month since May. The size of the fall has now shrunk two months running.
| Month | Average price | Annual change |
|---|---|---|
| May 2026 | £379,042 | -0.4% |
| June 2026 | £378,832 | -2.3% |
| July 2026 | £378,012 | -2.3% |
| August 2026 | £378,055 | -2.0% |
| September 2026 | £378,412 | -0.8% |
The average price itself has hardly moved since May, staying between £378,000 and £379,100. The annual fall is narrowing mainly because last autumn’s prices were lower than last summer’s, so the comparison is easier.
Semi-detached homes are rising again
| Type | Average price | Annual change |
|---|---|---|
| Detached | £682,616 | -0.8% |
| Semi-detached | £424,535 | +0.5% |
| Terraced | £339,660 | -0.1% |
| Flat or maisonette | £207,628 | -3.1% |
Semi-detached homes are the only type up on a year. Terraced homes are almost level.
Flats are still down the most, at 3.1%. That is now slightly better than England, where flats fell 3.3%, but worse than the East of England at 1.6% and Essex at 1.8%.
Most of Essex is rising
| Authority | Average price | Annual change |
|---|---|---|
| Maldon | £406,165 | +5.0% |
| Harlow | £317,113 | +3.9% |
| Epping Forest | £536,719 | +2.1% |
| Southend-on-Sea | £327,570 | +1.8% |
| Rochford | £408,883 | +1.3% |
| Colchester | £297,638 | +0.9% |
| Basildon | £367,920 | +0.8% |
| Braintree | £324,264 | +0.5% |
| Brentwood | £520,447 | +0.2% |
| Uttlesford | £465,802 | -0.5% |
| Castle Point | £368,191 | -0.7% |
| Thurrock | £322,338 | -0.7% |
| Chelmsford | £378,412 | -0.8% |
| Tendring | £258,932 | -2.2% |
Nine Essex authorities rose and five fell. Maldon, next door to the east, had the biggest rise in the county at 5.0%, and its average is now about £27,800 above Chelmsford’s.
Across the country, prices are rising slowly:
- England +0.8%, to £292,998
- East of England +0.7%, to £338,357
- United Kingdom +1.2%, to £272,642
- Essex as a whole +0.5%, to £360,791
First-time buyers
The average first-time buyer purchase in Chelmsford was £298,428 in September, down 0.9% on a year ago. Across England it was £245,052, up 0.8%.
A first home in Chelmsford costs about £53,400 more than the English average. A year ago the gap was about £58,100, so it has narrowed by about £4,700.
What it means for you
- If you are buying, the average is about £3,000 lower than a year ago. The biggest discount is still on flats, down 3.1%.
- If you are selling a semi, prices are up 0.5% on a year, the only type in the district to rise.
- If you are selling a flat, expect offers below what similar flats fetched in 2025.
- If you want the street-level picture, the average house price in each part of Chelmsford comes from Land Registry sale records, as medians rather than means.
One month in one district rests on a few hundred sales, and the figures will be revised next month.
Sources
- HM Land Registry UK House Price Index, Chelmsford, September 2026 for the £378,412 average, the 0.8% annual fall and 0.1% monthly rise, the figures by property type, the first-time buyer averages for September 2025 and 2026, and the revised monthly series, read 18 November 2026.
- HM Land Registry UK House Price Index, England and the equivalent pages for the East of England, the United Kingdom, Essex and the 14 Essex authorities in the table, read 18 November 2026.
- GOV.UK: UK House Price Index for September 2026 for the 18 November 2026 publication date.
- Our August 2026 report for the figures as first published last month.
Have your say