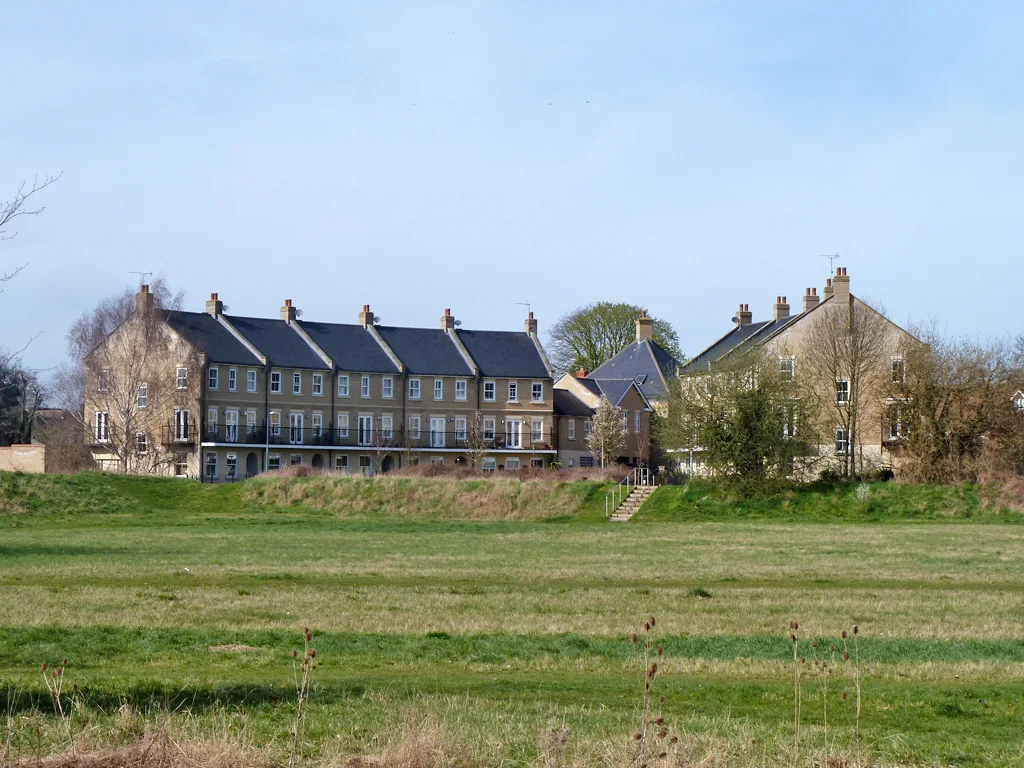

The average Chelmsford home was worth £376,682 in August, 2.4% down on a year. Only Castle Point fell further in Essex, while Braintree and Maldon rose.
Chelmsford house prices fell again in August, for the fourth month running. The average home in the district was worth £376,682. That is £9,076 less than in August 2025, a fall of 2.4% (HM Land Registry).
Only one of the 14 local authorities in Essex has fallen further: Castle Point, down 4.0%. Last month Brentwood was also below Chelmsford. In August it was up 0.3%.
The figures come from the UK House Price Index for August, published on 21 October (GOV.UK). They are built from completed sales lodged with the Land Registry, so they run two months behind.
Two things to know before the numbers:
- This is a mean average, not a median. A few expensive sales pull it up.
- The index is revised every month. July now reads £377,541 and a 2.4% fall. We reported it last month as £378,080 and 2.3%, the figures published then. The revisions have again made the picture slightly worse.
Four months of falls, and no sign of a turn
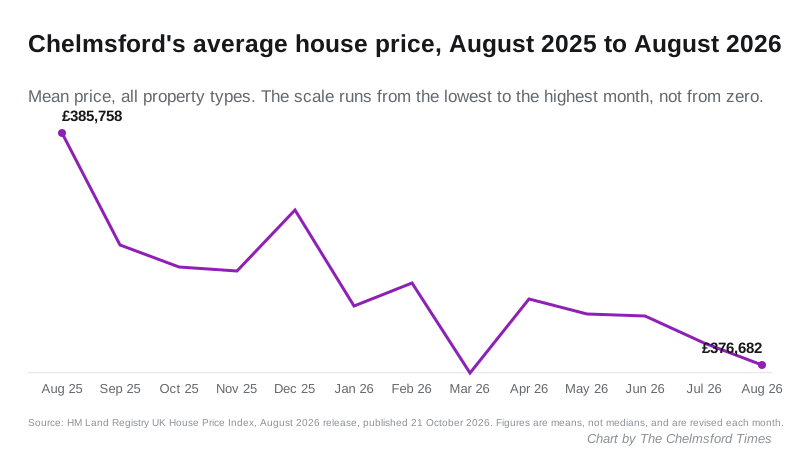
On the revised figures, Chelmsford prices have been lower than a year earlier in every month since May.
| Month | Average price | Annual change |
|---|---|---|
| March 2026 | £376,376 | +0.6% |
| April 2026 | £379,258 | 0.0% |
| May 2026 | £378,681 | -0.5% |
| June 2026 | £378,576 | -2.3% |
| July 2026 | £377,541 | -2.4% |
| August 2026 | £376,682 | -2.4% |
August was down 0.2% on July, about £860. July and August share the steepest annual fall recorded here since September 2024, when prices were 2.6% down on the year.
Detached homes are now falling fastest after flats
| Type | Average price | Annual change |
|---|---|---|
| Detached | £676,766 | -2.8% |
| Semi-detached | £422,542 | -1.1% |
| Terraced | £339,024 | -1.3% |
| Flat or maisonette | £207,458 | -4.6% |
Flats are still down the most, at 4.6%. That is worse than England, where flats fell 2.9%, the East of England at 1.3% and Essex at 2.6%.
The change since July is in detached homes. Their annual fall has widened from 2.4% to 2.8%, and they lost 0.6% in August alone, the biggest monthly drop of any property type in the district.
Essex splits down the middle
| Authority | Average price | Annual change |
|---|---|---|
| Harlow | £317,453 | +4.3% |
| Braintree | £330,089 | +1.6% |
| Maldon | £393,909 | +1.3% |
| Rochford | £405,340 | +0.5% |
| Basildon | £366,218 | +0.4% |
| Brentwood | £522,672 | +0.3% |
| Uttlesford | £468,166 | +0.1% |
| Southend-on-Sea | £326,132 | 0.0% |
| Epping Forest | £530,653 | -0.3% |
| Tendring | £260,636 | -1.2% |
| Colchester | £294,210 | -1.4% |
| Thurrock | £319,969 | -1.4% |
| Chelmsford | £376,682 | -2.4% |
| Castle Point | £357,241 | -4.0% |
Seven Essex authorities rose, six fell and Southend-on-Sea stood still. The three districts that border Chelmsford to the north and east all rose: Braintree up 1.6%, Maldon up 1.3% and Uttlesford up 0.1%. Basildon, to the south, was up 0.4%.
Across the country, prices are still rising slowly:
- England +0.4%, to £293,525
- East of England +0.2%, to £337,848
- United Kingdom +0.9%, to £273,037
- Essex as a whole -0.3%, to £359,433
So Chelmsford’s fall is not a national slide. It is local, and steeper than almost everywhere around it.
First-time buyers
The average first-time buyer purchase in Chelmsford was £297,135 in August, down 2.5% on a year ago. Across England it was £246,042.
A first home in Chelmsford still costs about £51,100 more than the English average. A year ago the gap was about £60,000, so it has narrowed by nearly £8,900, because Chelmsford fell while England rose 0.6%.
What it means for you
- If you are buying, prices are about £9,000 lower than a year ago on average, and the bigger discount is on flats and detached homes.
- If you are selling, these are completions from August, which means offers agreed in early summer. A valuation based on last year’s sales on your street is likely to be too high.
- If you are remortgaging, a 2.4% fall will not move most owners into a worse loan-to-value band. A flat bought near the 2025 peak, down 4.6%, is more at risk.
- If you want the local detail, our Chelmsford house prices page breaks the district down by area from Land Registry sale records, which are medians rather than means. Our council tax bands page shows what each band costs.
One month in one district rests on a few hundred sales, and the figures will be revised. Four months in a row pointing the same way is harder to dismiss.
Sources
- HM Land Registry UK House Price Index, Chelmsford, August 2026 for the £376,682 average, the 2.4% annual and 0.2% monthly falls, the figures by property type, the first-time buyer averages for August 2025 and 2026, and the revised monthly series back to 2024, read 24 October 2026.
- HM Land Registry UK House Price Index, England and the equivalent pages for the East of England, the United Kingdom, Essex and the 14 Essex authorities in the table, read 24 October 2026.
- GOV.UK: UK House Price Index for August 2026 for the 21 October 2026 publication date.
- Our July 2026 report for the figures as first published last month.
More on Chelmsford
- Chelmsford house prices: what homes actually sell for, area by area.
- Chelmsford council tax bands: every band, every parish.
- Chelmsford planning news: what is being built and where.
- Chelmsford trains to London: times, fares and the last train home.
Have your say