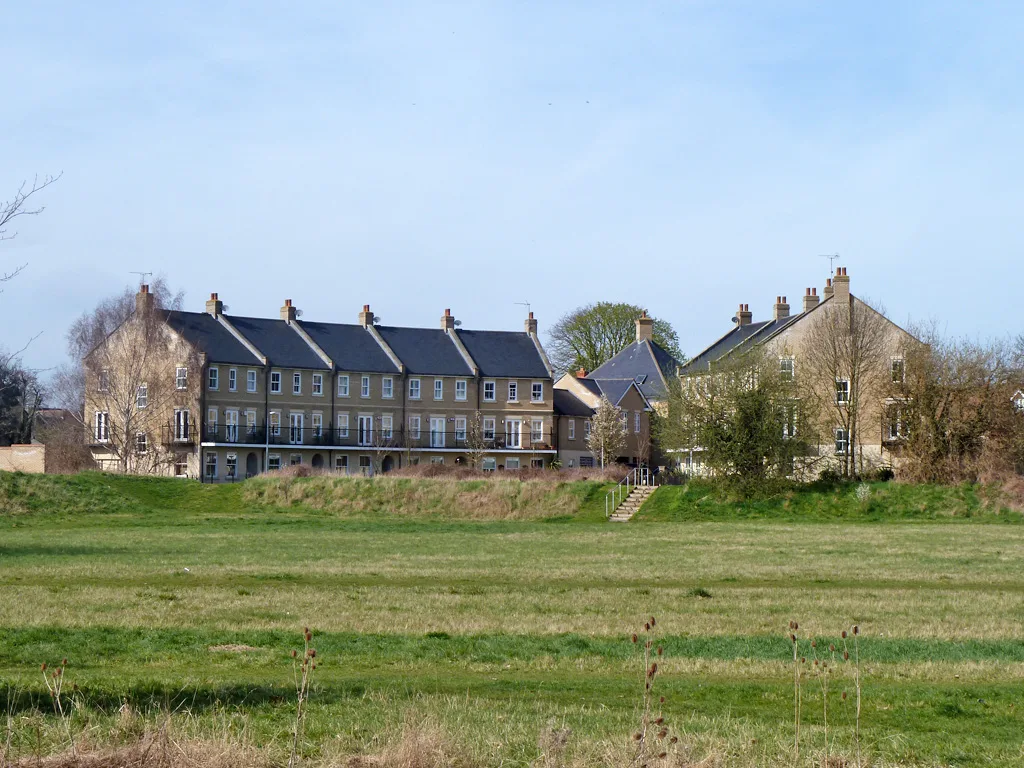

The average Chelmsford home is worth £383,103, down £4,565 on a year ago. Only 62 of 295 English districts fell, and five of them are in Essex.
Chelmsford house prices are lower than they were a year ago for the first time since September 2024. The average home in the district was worth £383,103 in June 2026, down 1.2%, or £4,565, on June 2025. (HM Land Registry)
The figures come from the UK House Price Index, published on 19 August. They matter because they are built from completed sales lodged with the Land Registry, not asking prices.
Two caveats before the numbers, both of which cut against a dramatic reading.
- This is a mean average, not a median. A handful of expensive sales pull it upwards.
- Prices did not actually fall in June. They rose 0.3% on May. The annual figure turned negative because June 2025 was an unusually strong month, not because this June was weak.
Chelmsford against the rest of England
A 1.2% fall sounds mild. In national terms it is not, because almost nowhere else fell at all.
Of the 295 local authority districts in England, only 62 recorded an annual fall. Chelmsford’s was the 38th steepest. Meanwhile the wider market kept rising:
| Area | Average price, June 2026 | Annual change |
|---|---|---|
| Chelmsford | £383,103 | -1.2% |
| Essex | £361,268 | +1.2% |
| East of England | £338,707 | +1.1% |
| England | £293,262 | +1.8% |
| United Kingdom | £272,188 | +2.0% |
So Chelmsford did not follow the county it sits in. Essex as a whole rose.
Five Essex districts are falling, and they are next to each other
The county average hides a split. Five of Essex’s 14 districts and unitaries were down over the year, and they cluster in the south and centre.
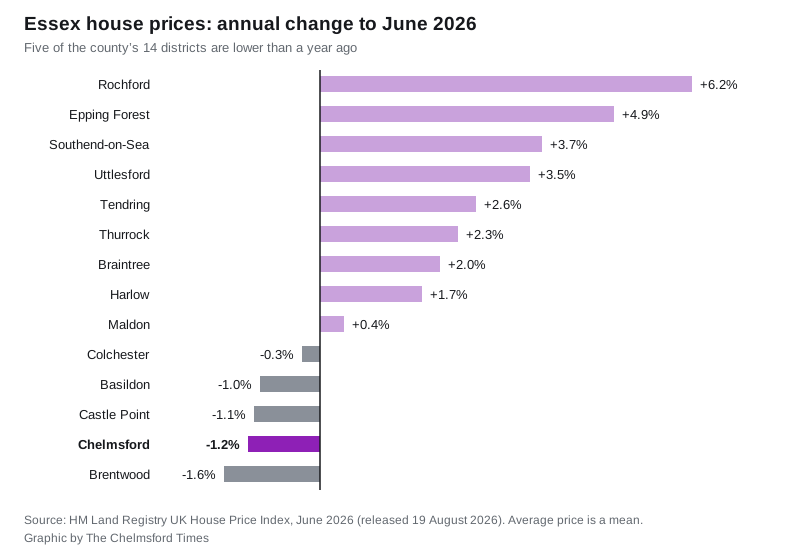
Rochford led the county at +6.2%. Brentwood was bottom at -1.6%, with Chelmsford just above it. The full order:
- Rochford +6.2%
- Epping Forest +4.9%
- Southend-on-Sea +3.7%
- Uttlesford +3.5%
- Tendring +2.6%
- Thurrock +2.3%
- Braintree +2.0%
- Harlow +1.7%
- Maldon +0.4%
- Colchester -0.3%
- Basildon -1.0%
- Castle Point -1.1%
- Chelmsford -1.2%
- Brentwood -1.6%
Chelmsford remains one of the more expensive places to buy in Essex, but only just inside the top four. Epping Forest (£536,765), Brentwood (£513,537) and Uttlesford (£482,652) are clearly ahead, and Maldon has now edged past it at £384,348, a difference of £1,245.
Flats and detached houses took it, semis did not
The district average conceals four very different markets.
| Property type | Average price | Annual change |
|---|---|---|
| Detached | £690,495 | -2.0% |
| Semi-detached | £429,216 | 0.0% |
| Terraced | £342,756 | -0.3% |
| Flat or maisonette | £211,852 | -2.6% |
The two ends of the market moved and the middle did not. Semi-detached homes are worth almost exactly what they were a year ago. Terraced houses barely shifted. The falls are concentrated in flats, down 2.6%, and in detached houses, down 2.0%, which in cash terms is nearly £14,000 off the typical detached home.
There is a similar split by buyer. Cash purchases were down 1.5% over the year, mortgaged purchases down 1.1%.
What it means for you
If you are buying your first home, the figure to watch is £302,772. That is the average first-time buyer price in Chelmsford, down 0.9% on a year ago. A £2,700 improvement over twelve months is not a market opening up, but it is the first time in nearly two years the direction has been in your favour.
If you are selling, the type of home matters more than the district trend. A semi is worth what it was. A flat is not, and neither is a large detached house.
If you are watching for a trend, wait. One month is not a trend. Chelmsford’s average has sat between £376,000 and £384,000 for the whole of 2026, and June’s £383,103 is near the top of that band, not the bottom. The annual comparison flipped because June 2025 happened to be a peak: the average jumped 1.9% in that single month to £387,668.
One more reason for caution. The index revises previous months as more sales are lodged, so today’s figure is not final. It is a small effect here, though: May was first published at £382,131 and now reads £382,122, a change of £9.
Sales volumes are worth treating separately, because they are still distorted. The Land Registry does not publish counts for the most recent two months, so the newest reliable figure for Chelmsford is April 2026, at 141 sales. Compare that with the stamp duty threshold change on 1 April 2025, which pulled completions forward and produced 450 sales in March 2025 and just 87 in April 2025. Any year-on-year sales comparison across that date is meaningless.
For the longer view, including median sale prices street by street and the gap between the city centre, Danbury, Writtle and South Woodham Ferrers, see our Chelmsford house prices page. The bill that follows a purchase is set out in Chelmsford council tax bands.
The next UK House Price Index release, covering July 2026, is due on 16 September.
Have your say