
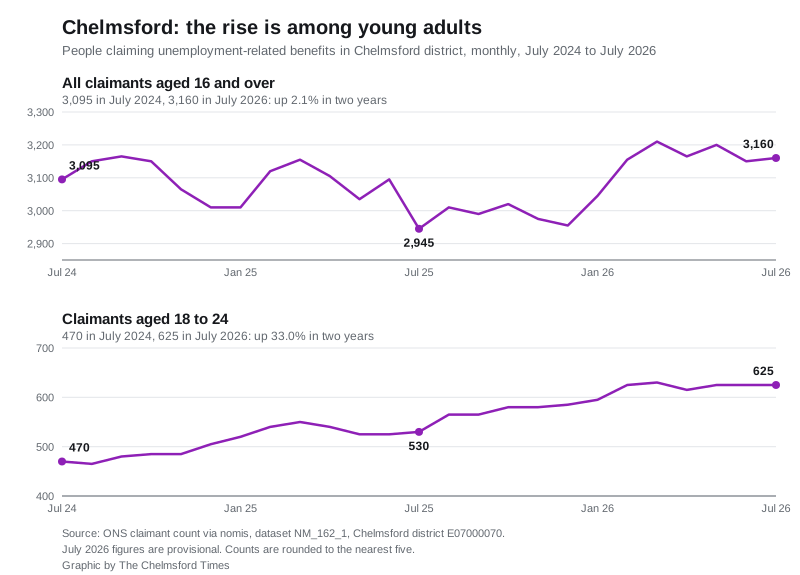
Chelmsford's claimant count hit 3,160 in July, 2.7% of working-age residents. Claims by 18 to 24-year-olds are up a third in two years, to 625. Ward figures below.
There were 3,160 people in the Chelmsford district claiming unemployment-related benefits in July, according to figures the Office for National Statistics released this morning. That is 2.7 per cent of residents aged 16 to 64, and 215 more people than in July last year.
The headline total is close to where it stood two years ago. Underneath it, one group has moved a long way.
Claims by people aged 18 to 24 have risen in almost every month since the summer of 2024. There were 470 of them in July 2024. There were 530 in July 2025. In July 2026 there were 625, a rise of a third in two years. Young adults now account for nearly one in five of everyone claiming in Chelmsford. Two years ago it was about one in seven.
The age split
These are the ONS claimant count figures for the Chelmsford district, taken in the same month each year.
| Age | July 2024 | July 2025 | July 2026 |
|---|---|---|---|
| 18 to 24 | 470 | 530 | 625 |
| 25 to 49 | 1,870 | 1,720 | 1,765 |
| 50 and over | 750 | 695 | 765 |
| All aged 16 and over | 3,095 | 2,945 | 3,160 |
The bands do not quite add up to the total because 16 and 17-year-olds are counted separately. There were five of them in July.
Read across the rows and the pattern is clear. The 25 to 49 group is still well below its 2024 level, down 105 over two years. The over-50s are up 15. The 18 to 24 group is up 155, which is more than the whole district’s net increase.
Where in Chelmsford
The ONS also breaks the count down by ward. The rate is the share of that ward’s residents aged 16 to 64.
| Ward | Claimants | Rate |
|---|---|---|
| St Andrews | 255 | 4.4% |
| Waterhouse Farm | 170 | 3.9% |
| Trinity | 160 | 3.7% |
| Patching Hall | 185 | 3.3% |
| Great Baddow East | 170 | 3.3% |
| Galleywood | 100 | 3.2% |
| Marconi | 210 | 3.1% |
| Rettendon and Runwell | 125 | 3.0% |
| Great Baddow West | 120 | 3.0% |
| Moulsham and Central | 330 | 3.0% |
| Boreham and The Leighs | 120 | 2.7% |
| Writtle | 75 | 2.5% |
| Chelmer Village and Beaulieu Park | 160 | 2.3% |
| Springfield North | 165 | 2.3% |
| Bicknacre and East and West Hanningfield | 75 | 2.2% |
| Little Baddow, Danbury and Sandon | 100 | 2.2% |
| Broomfield and The Walthams | 160 | 2.1% |
| The Lawns | 70 | 2.1% |
| Goat Hall | 75 | 2.1% |
| South Woodham-Elmwood and Woodville | 90 | 1.9% |
| Moulsham Lodge | 60 | 1.8% |
| South Woodham-Chetwood and Collingwood | 90 | 1.8% |
| Chelmsford Rural West | 35 | 1.7% |
| South Hanningfield, Stock and Margaretting | 55 | 1.6% |
Moulsham and Central has the largest number of claimants, 330, because it is a populous ward covering the city centre. St Andrews has the highest rate at 4.4 per cent, close to three times the rate in South Hanningfield, Stock and Margaretting. The ward figures are each rounded to the nearest five, which is why they total 3,155 rather than 3,160.
How Chelmsford compares
Chelmsford’s 2.7 per cent is below the Essex county rate of 3.1 per cent, the East of England rate of 3.3 per cent and the UK rate of 3.9 per cent. Among the twelve Essex districts it is joint sixth lowest, level with Braintree.
- Lowest in Essex: Uttlesford, 2.0 per cent
- Highest in Essex: Harlow, 4.6 per cent, then Tendring on 4.1 per cent and Basildon on 3.8 per cent
The direction is less comfortable than the level. Over the year to July, the number claiming rose 7.3 per cent in Chelmsford, 5.3 per cent across Essex and 2.9 per cent across the East of England. Chelmsford is starting from a better place and moving away from it faster than the county around it.
Nationally, the ONS put the UK unemployment rate at 4.9 per cent for April to June 2026 and estimated 707,000 job vacancies for May to July, down 6,000 on the February to April figure. Fewer vacancies is the backdrop against which a first-time jobseeker is looking.
What the claimant count is, and is not
This is not the unemployment rate, and the two are often confused. The claimant count is the number of people claiming Jobseeker’s Allowance plus those claiming Universal Credit who are required to seek work and be available for work.
That means it misses people who are out of work but not claiming, and it includes some people who are working but on low enough earnings to still face a work-search requirement. Changes to benefit rules can move the number without anything changing in the local job market. July 2026 figures are provisional and can be revised.
What it means for you
If you are 18 to 24 and looking for work in Chelmsford. The figures say you are not an outlier and the market is tighter than it was. A level results came on 13 August and Ofqual publishes GCSE and other level 2 results on 20 August, so competition for entry-level roles and apprenticeships is about to increase again. Apprenticeship vacancies are listed on the government’s find an apprenticeship service. The National Careers Service takes calls on 0800 100 900, 8am to 8pm on weekdays and 10am to 5pm on Saturdays.
If you have just lost work. Council tax is usually the bill worth dealing with first. Chelmsford City Council runs its own Council Tax Reduction scheme, and for a working-age household the most it will take off is 77 per cent of the bill. You will still owe at least 23 per cent whatever your income. You cannot claim at all if you have more than £6,000 in savings or capital, or more than £16,000 if you are of pension age and not receiving Guarantee State Pension Credit. Our page on Chelmsford council tax bands sets out what each band costs in each part of the district, so you can see what the 23 per cent would actually be.
If you are reading this as a landlord, employer or seller. The rise is concentrated in one age group rather than spread across the district. The overall level remains in the lower half of Essex. Chelmsford’s house price figures have been broadly flat over the same period.
The next claimant count, covering August 2026, is due on 15 September.
Sources
- ONS claimant count, dataset NM_162_1, via nomis for the Chelmsford district totals, the age bands, the ward breakdown and the Essex, regional and UK rates. Chelmsford district code E07000070; ward figures use the May 2025 ward boundaries.
- ONS labour market overview, UK, August 2026, released 18 August 2026, for the national unemployment rate, the vacancies estimate and the next release date.
- nomis claimant count source notes for the definition of the count.
Have your say